

Just Your Average Millionaire
Just Your Average Millionaire
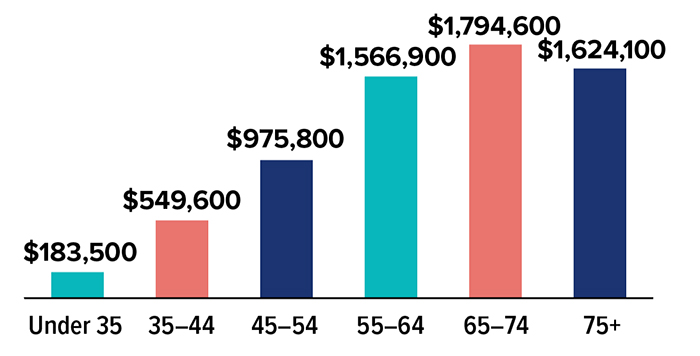
The Federal Reserve’s Survey of Consumer Finances (conducted every three years) revealed that the average net worth of U.S. families surpassed $1 million ($1,063,700) for the first time in 2022, after increasing 42% from 2019. (A family’s net worth is the total of their financial assets minus their liabilities, or debts.) The historic rise during the 2019–2022 period was due in part to pandemic-era stimulus payments and low interest rates, which pushed up home values and stock prices. And overall, these financial gains far outpaced the losses in purchasing power caused by high inflation.

Unfortunately, having a national average net worth that exceeds $1 million does not mean the typical American is a millionaire. A small number of very wealthy households skews the average. As always, the median net worth ($192,900 in 2022) was much lower than the average, but its growth was by far the largest on record. Even after adjusting for inflation, the three-year increase in the median net worth (37%) rose more than the average (23%), showing that wealth inequality narrowed.
Still, the net worth of U.S. families varies greatly depending on housing status, education, and income level. Only about 12% of U.S. families have a net worth above $1 million, and many of those are older. This emphasizes the financial reality that for most people it takes time and diligence to build wealth.
Number of Millionaire Households

Source: The Wall Street Journal, October 27, 2023
Average (mean) net worth, by age group

Source: Federal Reserve, 2023

